West Pittwater

Community Association


Offshore Survey

(Scotland Island & Western Shores)


prepared by

Kerry Borthwick


for and on behalf of

SIRA & WPCA


                                                                                          May 2007
1.       background

The Scotland Island Residents Association (SIRA) and the West Pittwater Community Association (WPCA) wanted to ensure they understood members’ needs and wishes in order to be able to represent them effectively generally and particularly in respect of negotiations with the Department of Lands and Pittwater Council regarding proposed changes to the Church Point Precinct.


Accordingly it was determined that conduct of a survey to identify demographic characteristics of the offshore community together with their transport and parking needs, and views on proposed changes to the Church Point precinct would be an appropriate undertaking.


2.       methodology


2.1            Confidentiality

An undertaking was given to the offshore community that the survey would be confidential, whereby their privacy would be maintained in respect of access to the raw data and only aggregated data results would be reported. 


2.2            Questionnaire Design

The questionnaire was designed by a sub-committee of representatives of both the offshore residents’ associations, ie the West Pittwater Community Association (WPCA) and the Scotland Island Residents Association (SIRA).  Members were as follows:


            Ian Souter (Committee Member, SIRA)

            Greg Roberts (Committee Member, SIRA)

            Bill Gye (Member, SIRA)

            Michael Wiener (President, WPCA)

            Shar Jones (President, SIRA)


The questionnaire was designed in two parts:

·                     Part A was similar to a census and solicited general demographic information relevant to offshore residents, including suburb; residential status; age; type of residence (eg whether primary residence or weekender); number of vehicles on and offshore and where they park; commuter boat numbers and mooring locations; types of transportation used on the mainland; main destinations on the mainland; public transport requirements; barriers to use of public transport; primary interchange; car pooling etc


·                    Part B sought information on offshore residents’ views on the Cargo Wharf at Church Point; parking along the roadway between the mini-market and Holmport Marina; the pontoon and heritage wharf at Thomas Stephens Reserve;  alternative dispersal points for car parking other than Church Point; the current Church Point carpark; preferred type of  structure if a new carpark built; whether they are able and/or prepared to purchase parking space(s); current commuter boat mooring locations offshore


Prior to finalisation the draft survey was tabled at a Church Point Precinct Design Group meeting attended by representatives of Pittwater Council, SIRA and WPCA and the two onshore residents’ groups, ie Bayview-Church Point Residents Association (BCPRA) and the Church Point Reserve Association (CPRA).  The purpose and content of the survey was discussed and the reason for the survey design being in two parts was discussed.  Points arising from the discussion were taken into consideration in finalising the questionnaire.


2.3     Distribution

The questionnaires were printed by Pittwater Council who also provided a return stamped addressed envelope to facilitate return of completed surveys.


WPCA and SIRA Presidents, Michael Wiener and Shar Jones, individually signed a  covering letter on behalf of both associations, addressing confidentiality and explaining the survey rationale (copy of letter attached as appendix 1).


Surveys were mailed out by SIRA and WPCA.  Surveys were sent to all property owners resident in Australia irrespective of whether they resided offshore, used the property as a weekender/holiday home or rented it out.  Pittwater Council ratepayer data was used to identify owners.  In addition SIRA and WPCA identified offshore rented properties and mailed a survey to each rented residence.


Distribution numbers are outlined in Table 1 below:


Table 1: Survey Distribution

Association

No.Owners

No.Renters

Total

SIRA


Scotland Island

351

52

403


WPCA


Elvina Bay

56


Lovett  Bay

(inc. Little Lovett)

68


Morning Bay

23


McCarrs Creek

22


Western Shores

-

24

193


Total Surveys Distributed


596


Surveys were initially requested to be returned by 26 March, however due to an initial slow response rate, follow up requests were made via the Pittwater Offshore Newsletter and notices in public places such as at wharves, and the return date was extended until completion of data entry on 30 April 2007.


2.4     Response Rate

When survey return was closed, the following numbers had been received and the response rates calculated (on the basis of surveys returned as a percentage of surveys distributed) as follows:


Table 2: Survey Response

Association

Total No. Returned

Response Rate %

SIRA


Scotland Island

216

53.6


WPCA


Elvina Bay

37

66.1

Lovett  Bay

(inc. Little Lovett)

44

64.7

Morning Bay

19

82.6

McCarrs Creek

3

13.6

Western Shores

1

n.a.

Total Western Shores

193

53.9


Total Offshore

330

55.4


The overall response rate as displayed in table 2 above was 55.4%.  Although the result is lower than hoped for, 55.4% is an outstanding response rate for a mail out survey.[1]


It should be noted that the overall response rate between Scotland Island and the overall Western Shores was similar.  There were some variations within the Western Shore areas however the numbers are too small to break down for analysis.  However it can be seen that there is a noteworthy difference in the response rate between the two smallest offshore locations, Morning Bay and McCarrs Creek (82.6% contrasted with 13.6% response rate respectively).  It is difficult to theorise the reason for this result although it could be speculated that the excellent Morning Bay response rate could be attributed in part to the efforts of the Morning Bay WPCA representative who was a strong supporter of the survey, championing it with her constituents.


An analysis of the response rate relative to owners vs renters revealed a similar result to the overall response rate:


Table 3: Owner/Renter Response

Residential Status

Total No. Returned

Response Rate %

Owner

281

54.0

Renter

42

55.3

Residential Status unspecified

7


2.5     Analysis and Interpretation

Data entry was undertaken on a PC and input into an Excel file.  It was then transferred into the software package used for the data analysis.


The analysis was undertaken using the Statistical Package for the Social Sciences, ie SPSS (V14.0), on a university mainframe computer via a remote PC.  The data analyst was Ms Kerry Borthwick[2], Director of Quality of Working Life Pty Ltd.


3.                 RESULTS

The results are presented below in the format of the questionnaire interspersed with comments on their interpretation where appropriate.


3.1       OFFSHORE SURVEY: PART A  


DWELLING

1.     FAMILY NAME(S)                                                                                                     Confidential


2.       (a)   STREET NUMBER & STREET                                                                       Confidential


       SUBURB                                                               

                ELVINA BAY                                                                                                      11.2%

                LITTLE LOVETT                                                                                                 2.1

                LOVETT BAY                                                                                                     11.2

                McCARRS CREEK                                                                                              0.9

                MORNING BAY                                                                                                   5.5

                SCOTLAND ISLAND                                                                                         65.5       

                WESTERN SHORES (unspecified)                                                                    0.3

                OFFSHORE (unspecified)                                                                                    3.3


                                                                              Graph 1


        (b)   LOT NUMBER                                                                                                    Confidential        


        (c)   CONTACT DAYTIME PHONE NUMBER                                    Confidential


3.     RESIDENTIAL STATUS

OWNER                                                                                                                        85.2%   

RENTER                                                                                                                       12.1

        BOARDER                                                                                                                     0.3       97.6%


                                                                                Graph 2


4.     NUMBER OF OCCUPANTS RESIDING AT THIS ADDRESS                         Mean     2.7

                                                                                                                                                Median  2

                                                                                                                                                Sum        883

                                                                                                                                                Range 1 – 9 persons


                                                      Graph 3

                                Occupants x households


5.     AGE OF EACH PERSON/OCCUPANT:                                                             Mode 51-60 years

                                                                                                                                                Range 0- >70 years


      0 – 5 YEARS                                                                                                    7.9%

        6 - 10 YEARS                                                                                                                 6.2

        11 – 14 YEARS                                                                                                             5.1

        15 – 17 YEARS                                                                                                             5.3

        18 – 20 YEARS                                                                                                             3.5

        21 – 30 YEARS                                                                                                             5.6

        31 – 40 YEARS                                                                                                           13.5

        41 – 50 YEARS                                                                                                           17.0

        51 – 60 YEARS                                                                                                           18.7

        61 – 70 YEARS                                                                                                           12.3

        OVER 70 YEARS                                                                                                          4.8


The modal age of survey respondents is 51 to 60 years. There are 19.2% of respondents under 15 years and 19.1% over 60 years (seniors).


It is intuitively believed that the offshore population demographic is changing in a number of ways, not the least of these being the trend for people to continue to live offshore until older ages than previously.  Add to this the acknowledged aging population in Australia generally, combined with the large aging baby boomer cohort plus the delay in publication of census data at the locality level, the Offshore Survey data becomes essential to the offshore residents associations and other stakeholders such as Council, to provide guidance in planning decision making.


The modal age group in the Offshore Survey is the 51-60 age group.  This is the “baby boomers” generation given that the “baby boomers” commenced being born following the end of World War II (1946) and the next cohort generation commenced in 1965.  Thus the oldest “boomers” were turning 60 last year and attained senior citizen status.  That the 51-60 age group is the modal group is significant in terms of access considerations for a large number of offshore residents over the next few years.


Despite there having been a census in 2006 it will be some time before detailed information is available down to the locality level.  The current census information available at this level is from the 2001 census.  This census data was compared to the survey information in respect of age.  The 2001 Census data for Scotland Island, Pittwater and Church Point were used in this comparison.  There is no separate census data available for the Western Shores communities as the population size is too small for separate analysis and the Australian Bureau of Statistics does not release it publicly presumably for reasons of confidentiality.


Table 3 below presents the comparative data:


Table 4:  Offshore Survey comparison with 2001 Census


Survey

2001 Census

Age group

Scotland Is & Western Shores

Scotland Is

Scotland Is

Pittwater

Church Pt

% less than 15 yrs

19.3

20.8

25.3

19.6

15.7

% 15 yrs & over

80.7

79.2

74.7

80.4

84.3

% over 60 yrs

17.0

14.7

5.2

14.0

16.9

% over 70 yrs

4.7

3.4

1.2

9.7

8.2

Total no. persons

881

594

731

52377

1121


Observation of the data contained in Table 3 reveals a number of interesting comparisons:


·         Scotland Island responses to the 2007 survey were 594, compared to 731 in the 2001 Census (ie 81.2% of the census tally).  Even accounting for survey responses from weekenders (less than 16% overall on both the island and western shores) which would reduce the permanent population count a large population increase on Scotland Island is evident, especially since the figure of 594 only represents a 53.6% response rate to the survey contrasted with approximately a 100% response rate for the Census.


·         The percentage of Scotland Islanders over 60 years is almost 3 times that of the Scotland Islanders in the 2001 Census, and the percentage of  Scotland Islanders over 70 years has also almost tripled since 2001.  Both these results are in line with general population trends and have significant bearings on access issues as discussed in relation to the modal group and “baby boomers”, however the “over 60’s” have already attained “senior citizen” status.  Accordingly decisions on parking need to account for the increasing accessibility needs of offshore seniors.


·         Scotland Island age results are very similar to the overall offshore population age results indicating that the island and western shore communities tend to be similar in this demographic.


·         The population of Church Point in 2001 was 1121 and the population of Scotland Island at that time was 731.  It is estimated that the Western Shores population is approximately half that of the island (backed up by the household number distribution figures in Table 1), accordingly it may be postulated that the population numbers offshore are close to that of Church Point.  It would be interesting to compare the proportions of membership representation between the various offshore and onshore associations so that stakeholder equity in negotiations is not compromised and representation levels are taken into consideration.


·         The age comparisons between the offshore population as revealed in the 2007 survey responses and the overall Pittwater population in 2001 (census) are almost equivalent with the exception of a lower percentage of persons over 70 years.  This is interesting and could suggest a lag effect which would be worth checking when the 2006 census data is available.  The reason for this comment is that it could assist in developing models for predicting offshore population demographic changes.
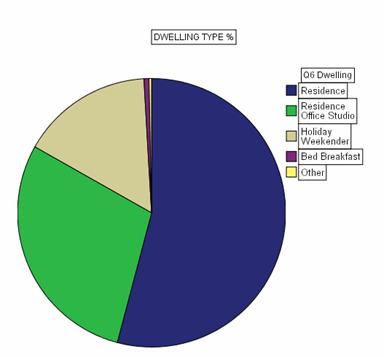


DWELLING

6.     USE OF DWELLING:

        RESIDENCE                                                                                                                53.6%                    Residence and home office/studio etc.                                      28.8

        HOLIDAY/WEEKENDER                                                                                        15.8       

        BED & BREAKFAST (B & B)                                                                    0.6       

        OTHER                                                                                                                           0.3

        NOT SPECIFIED                                                                                                           0.9       


        Note: “Other” cited was “Youth Hostel”.


                                        Graph 4


7.       If you answered YES to HOLIDAY/WEEKENDER, please enter the

        AVERAGE DAYS’ OCCUPATION PER MONTH                                               Median  8 days

                                                                                                                                                Modes    8, 10 days

                                                                                                                                                Range    1 – 20 days


CARS

8.       TOTAL NUMBER OF VEHICLES (CARS/TRUCKS)                                        Total      319

         PER PROPERTY ONSHORE AND OFFSHORE                                  Median  2

        (ie including motor cycles)                                                                                        Mode     2

                                                                                                                                                Range    1-9


9.     NUMBER OF VEHICLES (excluding motor cycles) USUALLY

         PARKED:

(a)      AT CHURCH POINT                                                                                        Total      283                                                                                                                                        Median  1

                                                                                                                                                Mode     1

                                                                                                                                                Range    1-4


It must be remembered that 283 vehicles only represents vehicles owned by 55.4% of offshore residents and that using this proportion as a base, it could be estimated that there would be more than 500 vehicles belonging to the offshore community requiring public parking in the vicinity of Church Point.


(b)      ELSEWHERE ON SHORE                                                                               Total      67

                                                                                                                                        Median  1

                                                                                                                                                Mode     1

                                                                                                                                                Range    1-4


Similarly to the comment in Q9(a), an estimated 120 vehicles owned by members of the offshore community would be parked elsewhere on shore.


10.  NUMBER OF vehicles used ON MAINLAND for work                      Total      123

        PURPOSES to transport tools, equipment,                                        Median   1

        materials etc.                                                                                                     Mode     1

                                                                                                                                                Range    1-4


11.  NUMBER OF VEHICLES PARKED OFFSHORE:

(a)     CARS                                                                                                                     Total      26

                                                                                                                                        Median  1

                                                                                                                                        Mode     1

                                                                                                                                        Range    0-2


(b)     TRUCKS                                                                                                               Total      6

                                                                                                                                        Median  1

                                                                                                                                        Mode     1

                                                                                                                                        Range    1-2


(c)     MOTOR CYCLES                                                                                               Total      13

                                                                                                                                                Median  1

                                                                                                                                                Mode     1

                                                                                                                                                Range    1-2


The vast majority of these vehicles are located on Scotland Island.


BOATS

12.  NUMBER OF COMMUTER BOATS PER HOUSEHOLD                 Total      290[3]

                                                                                                                                                Median  1

                                                                                                                                                Mode     1

                                                                                                                                                Range    1-4


13.  NUMBER OF COMMUTER BOATS MOORED AT CHURCH POINT          Total      226

                                                                                                                                                Median  1

                                                                                                                                                Mode     1

                                                                                                                                                Range    1-4


The majority, but not all of these boats moor at the Commuter Wharf.  A small number moor on the beaches around Church Point, either the small beach at the commuter wharf, the beach at Thomas Stephens Reserve or the beach at the northern end of the carpark.


14.  (a)   NUMBER OF COMMUTER BOATS MOORED AT                                   Total      70

                OTHER DISPERSAL POINTS                                                                         Median  1                                                                                                                                                              Mode     1

                                                                                                                                                Range    0-3

(b)     If you entered a number forQ14(a):

         PLEASE IDENTIFY THE RELEVANT DISPERSAL POINTS:


        Responses included:       

            Holmport Marina, Quays Marina, Bayview Anchorage/Gibsons Marina.

            Royal Motor Yacht Club, Royal Prince Alfred Yacht Club


The various dispersal points mentioned also provide parking for boat owners’ vehicles which is a prime reason for renting a berth.  The costs of renting commuter boat berths at the various marinas and/or clubs can exceed $5000/year.  There are also waiting lists for places.

COMMUTER DETAILS (per person)


15.  AVERAGE No. OF DAYS COMMUTING PER WEEK (PER PERSON)                                                                                                                                                                    median  5                                                                                                                                                                      Mode     5

                                                                                                                                                Range 1-7            


16.  MODES OF TRANSPORTATION TO/FROM THE MAINLAND BY WATER (PER PERSON)

Please rank in order of frequency of use.  If you don’t use a particular mode, please leave it blank.  For example if you mostly travel by motor boat you would give that a rank of 1, and then if you travel next most often by ferry, you would rank that as 2, and if you travel least often by water taxi you would give it a rank of 3.   Finally if you never travel by rowboat/canoe/kayak you would leave that option blank

                        .                                                                               Rank    No. Persons Using Mode

        ROW BOAT/CANOE/KAYAK                                          4                             48                        

        MOTOR BOAT (INCLUDING TINNIES)                                1                           286                        

        FERRY                                                                                             2                           273                        

        WATER TAXI                                                                                3                             46


17.  MODES OF TRANPORTATION ON THE MAINLAND  (per person)

        Please rank in order of frequency of use (as for Q16 above). If you don’t use a particular mode             please leave it blank.  Please don’t include walking from the wharf to your car at Church Point.

                                                .                                                               Rank    No. Persons Using Mode       CAR                                                                       1                        770   

        VAN/SMALL TRUCK                                                               8                                36                     

        MOTORBIKE                                                                              9                                17                     

        PUSH BIKE                                                                                 7                   50 

        BUS                                                                                                2                              292                     

        TAXI                                                                                              4                              103           

        TRAIN                                                                                           5                                61  

        WALK                                                                                           3                              131                 

        SYDNEY HARBOUR FERRIES                                              6                                53                            


18.  MAINLAND DESTINATION

We would like to obtain an idea of the directions people travel on the mainland in order to understand transport and parking needs.

        PLEASE ENTER THE POSTCODES OF YOUR THREE MOST FREQUENT DESTINATIONS

                                                                                                                                                Mode 2103

                                                                                                                                                Range 1635-2790                                    


                                Rank (First 10)                              Postcode        Location         Percentage

                                                1                              2103                       Mona Vale            17.8%

                                                2                              2000                       Sydney CBD        13.9

                                                3                              2106                       Newport                   5.3

                                                4                              2105                       Church Point          5.2

                                                5                              2107                       Avalon Area           3.2

                                                6                              2100                       Brookvale Area     3.4

                                                7                              2099                       Dee Why                 2.4

                                                8                              2101                       Narrabeen               2.0

                                                9 )                           2065                       Crows Nest            ( 1.9

                                                   )                            2095                       North Sydney       ( 1.9

                                                   )                            2102                       Warriewood          ( 1.9


The most frequent destination reported was Mona Vale, this is a typically expected response as it is not only the nearest shopping precinct to the offshore community but is the location of Mona Vale Public School, Pittwater High School, Sacred Heart Primary School, banks, churches, childcare facilities, sporting fields and gymnasiums.


The next most significant destination recorded was the Sydney CBD reflecting work related commuting with a lesser influence from social activities on weekends.  Lack of appropriate direct public transport from Church Point to the City is a cause of concern due to limitations on the hours of operation.  For instance the first ferry which picks up from all island wharves arrives at Church Point at 7:25am and the peak hour bus to the Sydney CBD now arrives at the Point at approx 7:45am.  Although it is timetabled to arrive at Central around 8:45am, it is a rare occurrence for it to arrive in the city before 9:00am.  Naturally this presents a problem for CBD workers.  Examining the situation for return from the city the last direct bus from the CBD leaves Central at approximately 5:30pm and is timetabled to arrive at Church Point at 6:47pm in time to meet the last ferries stopping at all the offshore wharves.  Again traffic delays often result in commuters using this bus missing the 7:00pm ferries and have to resort to water taxis at upwards of $20/trip.  In order to avoid these problems a number of commuters drive to Mona Vale and leave their vehicles there in order to catch express buses to the city to enable them not only to arrive at work on time but get home.


SCHOOL FERRIES AND BUSES (per person)

                                                                                                                                                % Persons

19.  DO YOU TRAVEL ON THE SCHOOL FERRY

        TO AND FROM NEWPORT SCHOOL                                                                               13.0%


20.  DO YOU TRAVEL ON A SCHOOL BUS

        TO AND FROM CHURCH POINT                                                                                      12.4%


PUBLIC TRANSPORT (per person)


21.  WHAT HOURS DO YOU REQUIRE PUBLIC

        TRANSPORT TO OPERATE?  

                                                                                                                              % All Acceptable Options

        24 HOURS/DAY MONDAY-FRIDAY                                                                       26.7%

        24 HRS SATURDAY/SUNDAY                                                                                   24.5%

        5:00AM – 1:00AM MONDAY-FRIDAY                                                                    49.4%

        6:00AM – 3:00AM SAT/SUN                                                                      36.4%


22.  WHAT FREQUENCY DO YOU NEED

        PUBLIC TRANSPORT TO OPERATE?

                                                                                                                                % All Acceptable Options

(a)     CHURCH POINT-CITY RETURN                                                   

PEAK HOURS WEEKDAYS                                                                                          29.7%                

        HOURLY WEEKDAYS                                                                                                   37.0%

        HOURLY WEEKENDS                                                                                                   36.4%

MORE THAN ONCE AN HOUR ON WEEKDAYS                             29.4%

        MORE THAN ONCE AN HOUR ON WEEKENDS                                            17.9%


 (b)  CHURCH POINT-MANLY WHARF RETURN                

        HOURLY WEEKDAYS                                                                                                    20.9%              

        HOURLY WEEKENDS                                                                                                    20.3%

        MORE THAN ONCE AN HOUR ON WEEKDAYS                                                9.4%

        MORE THAN ONCE AN HOUR ON WEEKENDS                                                     13.9%

        DO NOT NEED TRANSPORT TO MANLY WHARF                                   15.2%

  (c) CHURCH POINT-CHATSWOOD RETURN                                     

        PEAK HOURS WEEKDAYS                                                                                           17.0%                           

        HOURLY WEEKDAYS                                                                                                    13.9%

        HOURLY WEEKENDS                                                                                             11.2%


23.  WHICH OF THE FOLLOWING CURRENTLY PREVENT YOU

        USING PUBLIC TRANSPORT?

        Note Rank and No of Persons are not equivalent comparisons.

                                                                                                                Rank    No. Persons Citing Reason       

        NEED TO TRANSPORT PETROL OR LPG                             7                                 87             

        NEED TO TRANSPORT ANIMALS                            9                                61

        NEED TO TRANSPORT LARGE OBJECTS                          

           (PLANTS, HOUSEHOLD GOODS)                                         5                               161                             

        NEED TO TRANSPORT WORK RELATED                        

          TOOLS/EQUIPMENT                                                               8                                 72     

        NUMEROUS SHOPPING BAGS                                                2                               272            

        TIME CONSTRAINTS                                                                1                               331                            

        TRANSPORT DOES NOT SERVICE  MY

          REQUIRED DESTINATIONS                                                  3                               283             

        LACK OF EXPRESS BUSES                                                      6                               191            

     INFREQUENT SERVICE                                                            4                               279                                      OTHER                                                                               10                                30     


Most common reasons for “Other”:  Difficulties with young children; inability to take children to child care and then get to work on time and pick up children from child care before it closes if using public transport; limited peak hour buses to and from city; problems with catching buses if working at North Sydney etc, ie connecting buses full and don’t stop; undertake shiftwork; no buses after midnight; poor coordination with Church Point ferries.


24.  PRIMARY INTERCHANGE (PER PERSON)

        Please tick transport interchange terminus per person       Rank                   Percentage                     

        CHURCH POINT                                                                            1                                 86.8%

        BAYVIEW MARINA                                                       3                                    3.4 

        OTHER DISPERSAL POINTS                                       2                                    9.7


25.  TOTAL ONE WAY TRIPS (per person)                      Mode      Range        Percentage[4]

(a)      TO CHURCH POINT PER WEEK                                             6                1-12           39.2%

(b)      FROM CHURCH POINT PER WEEK                         6               1-12            9.6

(c)    TO OTHER DISPERSAL POINTS PER WEEK                      1                1-12                  40.2

(d)    FROM OTHER DISPERSAL POINTS PER WEEK               1                1-12                 11.0


26.    CAR POOLING (per person)                                                                                % Persons

(a)   ARE YOU CURRENTLY INVOLVED IN CAR POOLING                                     7.6% involved

AS A PASSENGER OR DRIVER?          


(b)  WOULD YOU BE INTERESTED IN PARTICIPATING                                          16.7% interested

IN ORGANISED CAR POOLING                                                 


27.  COMMUNITY CAR SHARING (per person)

A new approach to commuting has been set up in Manly and other local government areas.which involves car sharing.  A commercial organisation provides a number of vehicles and users pay a monthly fee together with a fee for the amount of time and mileage used.  Information is available on www.goget.com.au

                                                                                                                                           % Persons

WOULD YOU BE INTERESTED IN CONSIDERING

THIS TYPE OF CONCEPT AS AN OPTIONAL                                       22.4% interested

ALTERNATIVE FORM OF TRANSPORT?                                         

.                                                                                                             

OFFSHORE SURVEY: PART B           


The following questions relate to the Options outlined in the Church Point Plan of Management – Issues and Options Paper, December 2006


They should only be answered by ADULT members of each household. 


Please tick each of the following statements you AGREE with :


CARGO WHARF (per adult)

(A = Adult 1, 2 etc) Please tick if YES                                                                             %  Adults ‘Yes’

28.  CLOSE AND RELOCATE CARGO WHARF                                                           

TO ROWLAND RESERVE                                                                                                       9.7%


29.    APPOINT AN ON-SITE MANAGER/RANGER,  AT THE

OFF-SHORE COMMUNITY’S EXPENSE, TO REGULATE                                               7.6%

THE USE OF CARGO WHARF, CAR PARKING AND

COMMUTER BOAT TIE UP


30.  INSTALL A SECURITY AND SURVEILLANCE SYSTEM                                              31.8%   


31.  PROVIDE A FENCED STORAGE AGREA BESIDE THE WHARF    

THAT COULD BE LEASED TO OFFSHORE RESIDENTS?                                             18.8%


32.  PROVIDE A PARKING BAY FOR WAITING TRUCKS?                                 53.3%


ROADWAY between MINI-MARKET and HOLMPORT

MARINA (per adult)

Please tick if YES                                                                                                                                   % Adults “Yes’

33.    ESTABLISH BETWEEN 40 AND 50 CARPARKING SPACES                          

ALONG THE CLIFF EDGE                                                                                                      39.1%   


34.    ESTABLISH BETWEEN 40 AND 50 CARPARKING SPACES                                       25.5%

        ALONG THE WATERFRONT                                                                    


35.    ESTABLISH BETWEEN 80 AND 100 CARPARKING SPACES                                    

ALONG THE CLIFF EDGE AND THE WATERFRONT                                                    69.4%


THE POINT/PASADENA (per adult)


36.    WHEN THE LEASE ON THE GREEN AREA IN FRONT OF THE

PASADENA EXPIRES IN 2013:

Please tick if YES

                                                                                                                                             % Adults ‘Yes’

(a)   DO NOT RENEW THE LEASE AND RETURN THE LAND TO OPEN

PUBLIC SPACE?                                                                                                                        54.5%                                                                        


(c)     FURTHER LIBERALISE THE LEASE TO PROVIDE INCREASED

        COMMUNITY ACCESS?                                                                                                         47.6%


THOMAS STEPHENS RESERVE (per adult)

Please tick if YES                                                                                                                                     % Adults ‘Yes”


37.  LEAVE THE TEMPORARY PONTOON WHERE IT IS?                                   37.6%


38.  RELOCATE THE TEMPORARY PONTOON TO THE OTHER SIDE OF

THE HERITAGE WHARF AND PROVIDE ACCESS FROM THOMAS

        STEPHENS RESERVE TO THE SMALL BEACH AND WATER?                  45.2%


GENERAL STORE AND HERITAGE WHARF (per adult)

Please tick if YES                                                                                    % Adults ‘Yes’

39.  REFURBISH THE OLD WHARF AS PER THE DRAFT 2004

        MASTER PLAN?                                                                                                                        73.9%


CARPARKING AREA (per vehicle)


40.  AS AN ALTERNATIVE TO CHURCH POINT WOULD

ANY OF THE DISPERSAL ZONES BELOW BE A SUITABLE

PERMANENT OPTION IF A COMMUTER PONTOON AND

PARKING WAS MADE AVAILABLE? Please tick all suitable

alternatives..               

(V = Vehicle 1, 2 etc)                                                                  Preference Rank  Percentage Suitable            

        BAYVIEW PUBLIC WHARF                                                                  2                              22.9%   

        NEWPORT PUBLIC WHARF                                                                  5                                7.1

        ROWLAND RESERVE BOAT RAMP                                                    3                              13.2

        McCARRS CREEK RESERVE                                                                4                                1.3

        NONE OF THE ABOVE                                                                             1                              40.6

        OTHER (Please specify):                                                                           6                                1.8


        Suggestions for other alternative dispersal zones included Taylor’s Point (several suggestions), and south of Holmport Marina.


                                                                                                                                   % Vehicle Owners ‘Yes’    

41.    DO YOU PREFER TO LEAVE THE CARPARK AS IT IS?                                               50.3%


42.    WOULD YOU BE PREPARED TO PAY AN ANNUAL FEE             

        OF APPROXIMATELY $150 PER VEHICLE FOR

NON-EXCLUSIVE USE OF THE EXISTING CARPARK                                  44.2%

AND A BOAT SPACE AT THE COMMUTER WHARF?

        Please tick if YES


43.    IF A CARPARK WAS TO BE CONSTRUCTED WHAT TYPE

WOULD YOU PREFER? (Please rank in order of preference. If

you don’t want a particular type of carpark, please leave it blank).              


                UNDERGROUND                                                                                                               13.3%

                HALF IN HALF OUT                                                                                                        22.1%

                ABOVE GROUND                                                                                                              26.7%

        NO PREFERENCE                                                                                                              26.4%


pLEASE ANSWER QUESTION 44 ON A PER HOUSEHOLD BASIS:


44.  If a carpark was built would YOU WANT TO BUY?

(a)   an underground exclusive use FREEHOLD

        (STRATA TITLE) or long term (eg 50 year)

        leasehold car parking SPACE costing

        APPROXIMATELY $85,000 - $100,000 initial cost AND

        WITH A MANAGEMENT, MAINTENANCE and                                     1 space = 5.5%

                REPLACEMENT lEVY OF approximately                                        2 SPACES = 2.7%

        $2000 PER YEAR?                                                                                            

                If YES please nominate number of spaces                                                TOTAL SPACES = 36


(b)   a partially in ground exclusive use                                                      OR

         FREEHOLD (STRATA TITLE) or long term

(eg 50 year) leasehold car parkingSPACE                               1 SPACE = 11.5%

        costing APPROXIMATELY $50,000 to $75,000                 2 spaces = 5.2%

initial cost AND WITH A MANAGEMENT,                                        3 SPACES = 0.3%

MAINTENANCE & REPLACEMENT lEVY OF                                        

APPROXIMATELY $500 PER YEAR?                                                   total spaces  = 75             

                If YES please nominate number of spaces                                                     


(c)   AN above ground FREEHOLD (STRATA TITLE)                                             or

        or long term (eg 50 year) leasehold car

        parking SPACE costing APPROXIMATELY                                     1 space = 20.9%

        $35,000 to $50,000 to purchase AND WITH                                     2 spaces = 11.8%

         A MANAGEMENT, MAINTENANCE & REPLACEMENT                     3 spaces = 0.9%

        lEVY OF APPROXIMATELY $250 PER YEAR?                                       4 spaces = 0.3%

                Please nominate number of spaces if YES                                                     

                                                                                                                                  TOTAL SPACES = 160


45   IF YOU ANSWERED YES TO THE PURCHASE OF A

PARKING SPACE, WHERE DO YOU CURRENTLY PARK

Please respond for each vehicle you would purchase a

parking space for.                                                                                              

CHURCH POINT PRECINCT        

                PARK AT CHURCH PT X PURCHASE UNDERGROUND = 72.4%

                 (26/36 SPACES)

                PARK AT CHURCH PT X PURCHASE PARTIAL INGROUN = 78.9%

                  (59/75 SPACES)

                PARK AT CHURCH POINT X PURCHASE ABOVE GROUND = 82.9%

                  (133/160 SPACES)


OTHER AREA                                                                    

                PARK OTHER AREA X PURCHASE UNDERGROUND = 27.6%

                  (10/36 SPACES)

                PARK OTHER AREA X PURCHASE PARTIAL INGROUND = 21.1%

                  (16/75 SPACES)                               

                PARK OTHER AREA X PURCHASE ABOVE GROUND = 17.1%

                (27/160 SPACES)


Intention to purchase by currently parking location is depicted in Graph 5 below:


                                                            Graph 5

Equity Issues Relevant to Purchase of Car Spaces:

It was hypothesised that there may be differences in ability and willingness to purchase car spaces.  Such differences may relate to age of the householder (eg young families and./or  older people such as retirees); renters vs owners (eg absent owners may not wish to purchase a space or may need to increase rents to cover costs of such a purchase); owners of waterfront properties who may have higher household incomes etc.; owners of  weekenders/holiday homes


If such differences are indicated by the survey data it could potentially be extremely divisive to the offshore community.


These propositions were investigated and the findings are reported below.


1.      Age and Ability/Willingness to purchase car space


1.1    Young families


“Young families” was defined as a household with at least one child aged between 0 and 10 years.  Seventy-three households responding to the survey met this criterion equating to 22.1% of respondent households.


                1.1.1       Underground


FAMILY WITH >= ONE CHILD 0-10 YEARS X PURCHASE SPACES UNDERGROUND

                                            =      2 INTENDING TO PURCHASE 1 SPACE

                                                     + 4  INTENDING TO PURCHASE 2 SPACES

                                          =       8   

               ie A TOTAL OF       10  out of 36 SPACES OR 27.8% OF SPACES


                or


                1.1.2       Part In Ground


                FAMILY WITH >= ONE CHILD 0-10 YEARS X PURCHASE SPACES PARTIALLY INGROUND

                                                =     8  INTENDING TO PURCHASE 1 SPACE

                                                           + 4 INTENDING TO PURCHASE 2 SPACES

                                                =     8

                                                          + 1 INTENDING TO PURCHASE 3 SPACES

                                                =     3

                ie A TOTAL OF        19  out of  75 spaces OR 25.3% OF SPACES


                or


                1.1.3       Above Ground


                FAMILY WITH >= ONE CHILD 0-10 YEARS X PURCHASE PACES ABOVE GROUND

                                                =  22 INTENDING TO PURCHASE 1 SPACE

                                                         + 10 INTENDING TO PURCHASE  2 SPACES

                                                =  20

                                                         + 1 INTENDING TO PURCHASE 3 SPACES

                                                =    3

                                                         + 1 INTENDING TO PURCHASE 4 SPACES

                                                =    4

                ie A TOTAL OF       49  out of 160 SPACES OR 30.6% OF SPACES.


                Examination of the results through comparison of the intention to purchase calculations with the group population proportion did not indicate a significant purchasing disadvantage from the “young family” population group.


1.2    Seniors


Traditionally, “seniors” are persons aged 60 years or more.  Given that our survey categories do not match exactly with this traditional group, “seniors” in the survey group are those members of the offshore community who are aged from 61 years.  This results in an under-estimation of the offshore “senior” population which should be taken into consideration when making decisions based on the findings in respect of the aging offshore population and their needs.


The number of households responding to the survey which meet the criterion of at least one (“senior”) member of the household aged 61 years or more was 108 equivalent to 32.7% of respondent households.


                1.2.1       Underground


                RESIDENCE WITH.>= ONE RESIDENT OVER 60 YEARS X PURCHASE         SPACES UNDERGROUND

                                            =     2 INTENDING TO PURCHASE 1 SPACE

                                                     + 2 INTENDING TO PURCHASE 2 SPACES

                                          =     4   

               ie A TOTAL OF       6  out of 36 SPACES OR 16.7% OF SPACES


                or


                1.2.2       Part In Ground


                RESIDENCE WITH .>= ONE RESIDENT OVER 60 YEARS X PURCHASE SPACES PARTIALLY INGROUND

                                                =    5 INTENDING TO PURCHASE 1 SPACE

                                                           + 4 INTENDING TO PURCHASE 2 SPACES

                                                =     8

                ie A TOTAL OF        13  out of  75 spaces OR 17.3% OF SPACES


                or


                1.2.3       Above Ground


                RESIDENCE WITH .>= ONE RESIDENT OVER 60 YEARS X PURCHASE SPACES ABOVE GROUND

                                                =  14 INTENDING TO PURCHASE 1 SPACE

                                                         + 6 INTENDING TO PURCHASE 2 SPACES

                                                =  12

                                                         + 1 INTENDING TO PURCHASE 4 SPACES

                                                =   30

                ie A TOTAL OF       56  out of 160 SPACES OR 35% OF SPACES.


It is clear from the preceding calculations that the “senior” group is disadvantaged in respect of intent/ability to purchase underground or partially above ground car spaces however this is not the case (for the group as a whole) in respect of above ground spaces. 


A comparison between the two age conditions and ability/willingness to purchase a car parking space in each of the three built options is delineated below:


                                                      Graph 6

2.      Waterfront Properties

Given that this question was not directly asked, it is not possible to determine a definitive answer however the majority of waterfront owners could be expected to moor their tinnies at private jetties rather than at public wharves or beaches offshore.


In this respect, 143 respondents report having at least one boat moored on a private jetty and 132 respondents report having at least one boat moored at a public wharf or on a beach, or 52% and 48% respectively.


The data showed:


2.1          Underground


                MOOR BOAT PRIVATE JETTY X PURCHASE SPACES UNDERGROUND

                                            =     13 INTENDING TO PURCHASE 1 SPACE

                                                     + 2  INTENDING TO PURCHASE 2 SPACES

                                          =       4   

               ie A TOTAL OF       17  out of 36 SPACES OR 47.2% OF SPACES


                or


2.2          Part In Ground


                MOOR BOAT PRIVATE JETTY X PURCHASE SPACES PARTIALLY INGROUND

                                                =   26 INTENDING TO PURCHASE 1 SPACE

                                                           + 11 INTENDING TO PURCHASE 2 SPACES

                                                =   22

                                                          + 1 INTENDING TO PURCHASE 3 SPACES

                                                =      3

                ie A TOTAL OF        51  out of  75 spaces OR 68% OF SPACES


                or


2.3          Above Ground


                MOOR BOAT PRIVATE JETTY X PURCHASE SPACES ABOVE GROUND

                                                =  38 INTENDING TO PURCHASE 1 SPACE

                                                         + 26 INTENDING TO PURCHASE  2 SPACES

                                                =  22

                                                         + 2 INTENDING TO PURCHASE 3 SPACES

                                                =    6

                                                         + 1 INTENDING TO PURCHASE 4 SPACES

                                                =    4

                ie A TOTAL OF     100  out of 160 SPACES OR 62.5% OF SPACES.


Given the assumptions made no formal statistical tests can be undertaken, however from the results presented and comparing these against the 58.6% of boats parked at private jetties (refer response to question 49(a)), no indication of a major difference in intention to purchase can be attributed to “waterfront” vs “non-waterfront” households.


Graph 7 below displays the results of the estimated “waterfront” residents’ intention to purchase car parking spaces:


                                                            Graph 7

3.   Renting vs Ownership

Despite the fact that it would be unlikely that a non-owner would be permitted to purchase a car parking space, a series of analyses of variance was carried out to determine whether any significant differences existed.


There were no significant differences between Renters and Owners in respect of intention to purchase underground parking spaces (F1,2 = 1.033; p = 0.357) or partially in ground parking spaces (F1,2  = 0.872; p = 0.419).  However there were significant differences between Renters and Owners (as expected) on intention to purchase above ground parking spaces (F1,2  = 5.667; p = 0.004) such that Owners were more prepared to purchase an above ground parking space.


Since the survey did not ask a question regarding landlord owners there was no way of distinguishing whether there were differences in intention to purchase car parking spaces between Resident and Landlord Owners.


3.      Weekender/Holiday Properties

Further analyses of variance were conducted to determine if there were differences in intention to purchase between dwellings used as Owners’ primary residence and those used as weekenders/holiday homes.


There were no significant differences in respect of any of the three conditions, ie intention to purchase underground (F 1,2 = 1.454; p = 0.235; partially in ground (F 1,2 = 2.004; p = 0.136); and above ground (F 1,2 = 0.516; p = 0.597).


PLEASE ANSWER QUESTIONS 46 TO 48 ON A PER HOUSEHOLD BASIS:


46   IF NO, WHY WOULD YOU BE UNWILLING TO PURCHASE

YOUR OWN SPACE?  Please tick all relevant options.                                        % Households

                UNABLE TO AFFORD/UNWILLING TO PAY PURCHASE PRICE                           43.6%                               UNABLE TO AFFORD/UNWILLING TO PAY MAINTENANCE LEVY            27.6%                                              DON’T OWN A VEHICLE                                                                       0.6%

                HAVE ALTERNATIVE PARKING                                                          4.2%

                DISAGREE ON PRINCIPLE                                                                                     40.6%


47.    IF A CARPARK WAS CONSTRUCTED, WOULD YOU AGREE            % Households ‘Yes’

        WITH IT BEING MANAGED BY AN OFFSHORE COOPERATIVE?                                                             Please tick if YES                                                                                                               58.5%


48.    WOULD YOU AGREE WITH A CAR PARK BEING BUILT

        AND MANAGED BY A PRIVATE CARPARKING COMPANY?                    22.7%

Please tick if YES                                                                                                                                       


Please answer Question 49 on a per commuter boat basis                 

49.    Where do you park your commuter boat off-shore:

(B = Boat 1, 2, 3 etc)  Please tick if YES


(a)     Private jetty?                                                                                             


Respondents reported that 234 boats were moored on private jetties, ie 58.6% of offshore commuter boats.


(b)     Public Wharf?                                                                                             

        If you answered YES to Public Wharf, please nominate the wharf

        (eg Bells, Lovett Bay, Elvina South etc)


There were 33.8% of commuter boats reported moored on public wharves offshore, 135 boats.


                                                                                                        No. Boats on Public Wharves

                        bells wharf (scotland island south)                                        11

                        carols wharf (scotland island south)                                    21

                        eastern wharf (scotland island east)                                     13

                        elvina bay north wharf                                                       5

                        elvina bay south wharf                                                      20

                        tennis wharf (scotland island north)                                     49


It will be observed that the number of boats reported moored on specific public wharves does not equate with the overall number of commuter boats moored on public wharves.  This result is due to a number of respondents not providing information on which wharf they moor their commuter boat.


(c)   On the beach?                                                                                             

     If you answered YES to On the Beach, please identify the beach

        (eg Cargo, Bill’s etc)


Thirty commuter boats (7.5%) were reported being moored on offshore beaches on Scotland Island and the bays.

                                                                                                                                No. Boats on Beach

                                bells beach (Scotland island sth)                                2

                                BILLS beach (Scotland Island Sth)                                 2

                                CARGO beach (scotland island west)                         11

                                Elvina bay beach                                                                        2

                                morning bay beach                                                                   1                           

                                tennis beach (scotland island nth)                             1

                                other beach (UNSPECIFIED)                                                    1           


                                TOTAL BOATS ON BEACHES                                                       20


Again due to a number of respondents failing to identify a specific beach, there are less boats identified as being moored at specific beaches than reported being moored on beaches in general.


50.  ANY GENERAL COMMENTS OR SUGGESTIONS:


There were a large number of comments and suggestions covering a wide variety of topics relevant to accessing offshore properties.  Some comments described the difficulties of access; others proposed solutions to the car parking and/or commuter wharf problems at Church Point; and others raised the notion of social justice and employed comparisons with other council areas’ parking solutions.


A small sample of pertinent comments are included below.


Areas of Sydney like city, beaches have limited parking and all solutions prioritise residents over visitors except here.


Use of car pooling or reducing family car ownership to 1 rather than 2 requires a small storage capability otherwise constant moving and rearranging of items.


Concern a constructed carpark with purchase options is divisive – those who can afford vs those who can’t.


Pressure carpark very difficult peak times but Pasadena functions make impossible.


Is there possibility upgrade Tennis? Pontoon needs replace and extend.


I purchased land in 1957 and built 57-58 and contributed to commuter wharf when first installed.


Refer past plans submitted by Dermer Bennett (architect) for carpark/mooring located in McCarrs Creek area.


While I have ticked box purchasing a spot I would find the capital outlay most difficult and see it only as last resort.


Church Point commuter wharf is a disaster area in terms of overcrowding/personal inconvenience/boat damage and theft forcing commuters onto expensive ferry/water taxi options.

Other dispersal points are too far over the water and subject to weather conditions.


This only addresses the carpark issue. Unless both car and boat parking issues are addressed, then we are not interested in car space/parking.  We prefer to pay a fee to park a commuter boat and car in serviced space at marinas.


I would like to see a mother & child tinny tie up at commuter wharf or a separate wharf for mothers & disabled.


Retired owners are unable to contribute.


Simple & cost effective 80/100 extra car spaces along waterfront & extend commuter boat ramp shop and Holmport.


Toilet block revamp. Men’s toilet has  no doors or seats. More disabled parking spots near Church Point end of car park. Extend commuter wharf cheaper & easier.


 If the road down from west Head was opened to West Pittwater residents it would help parking problems at Church Point.


Has the Council researched the income of all offshore residents? Are they certain we could afford the suggested options? What happens to those who cannot pay?


What will happen too landing of more fragile boats ie wood & fibre glass less weight less fuel - are these to be abandoned, these which save our environment as there is no place to put them. Car park save place for push bikes.


As Island zoned residential, Council has responsibility to provide appropriate parking.


Bridge to Scotland island.  Keyed use of roads for Western Shores.


I have been parking here for 45 years In 27 years position has worsened by land subsidence and no provision for different bikes (motor and pedal).


 Ca parks need to be serviced by ferry and commuter tinny traffic to give householders the option to use public transport and still get to the car.


Householders need the option to use public transport or own boat and still get to the car.


We don’t in principle disagree with concept of paid parking but don’t have capacity to meet such high initial outlays.  Solution? Yearly lease of a guaranteed car space.


Designated reserved places for residents free by display stickers at ferry end and paid designated visitor parking at Mona Vale end.


 Still don’t understand why inner city residents have right to park in street to exclusion of visitors.


How do authorities allow private business profit at expense of people trying to access homes?


Need full time water policing not current part time.


Take over Holmport.


Onshore (residents) need to recognise offshore community is people living everyday lives and that there is not an unfair burden.


If lines were drawn on current carpark 10—20 more cars would fit without any other changes.


Commercial marinas/yacht clubs offer car and boat parking for less than options here.


Appendix 1:

Offshore Survey Cover Letter


[1] Since closing off the survey data collection, 3 additional surveys were returned, two from Lovett Bay and one from Scotland Island.


[2] Kerry Borthwick BA(Hons)(Psych)DipEd,MAPS,MHFESA,MAEA,Registered Psychologist is an experienced data analyst.  Relevant experience includes tutoring Statistics at Macquarie University; holding a three year appointment as the Gladys Pattison Research Fellow in Stress and Cancer (1985-1987); being an Independent Assessor for the National Health & Medical Research Council (1989-1999); Convenor, RSI (OOS) Researchers' Group of NSW (1986-1987); coordinating research at the Sydney Hospital Occupational Health & Safety Service; membership of the Australian Epidemiological Association; recipient of grants for quantitative research; conduct of numerous quantitative research and consultancy projects; and authorship of  a number of articles based on quantitative research in refereed journals.

[3]  It will be observed that the sum of Qs 13 and 14(a) exceeds that of Q12.  The data has been checked and this is due to inconsistency between responses

[4] Percentages TO and FROM the same destination differ as respondents’ inward journeys may depart from a different dispersal point than the outward journey